> ## Documentation Index
> Fetch the complete documentation index at: https://docs-old.tilebox.com/llms.txt
> Use this file to discover all available pages before exploring further.
# Create a Sentinel-2 RGB image
> Query a cloud-free Sentinel-2 scene and render an RGB image from its public COG assets.
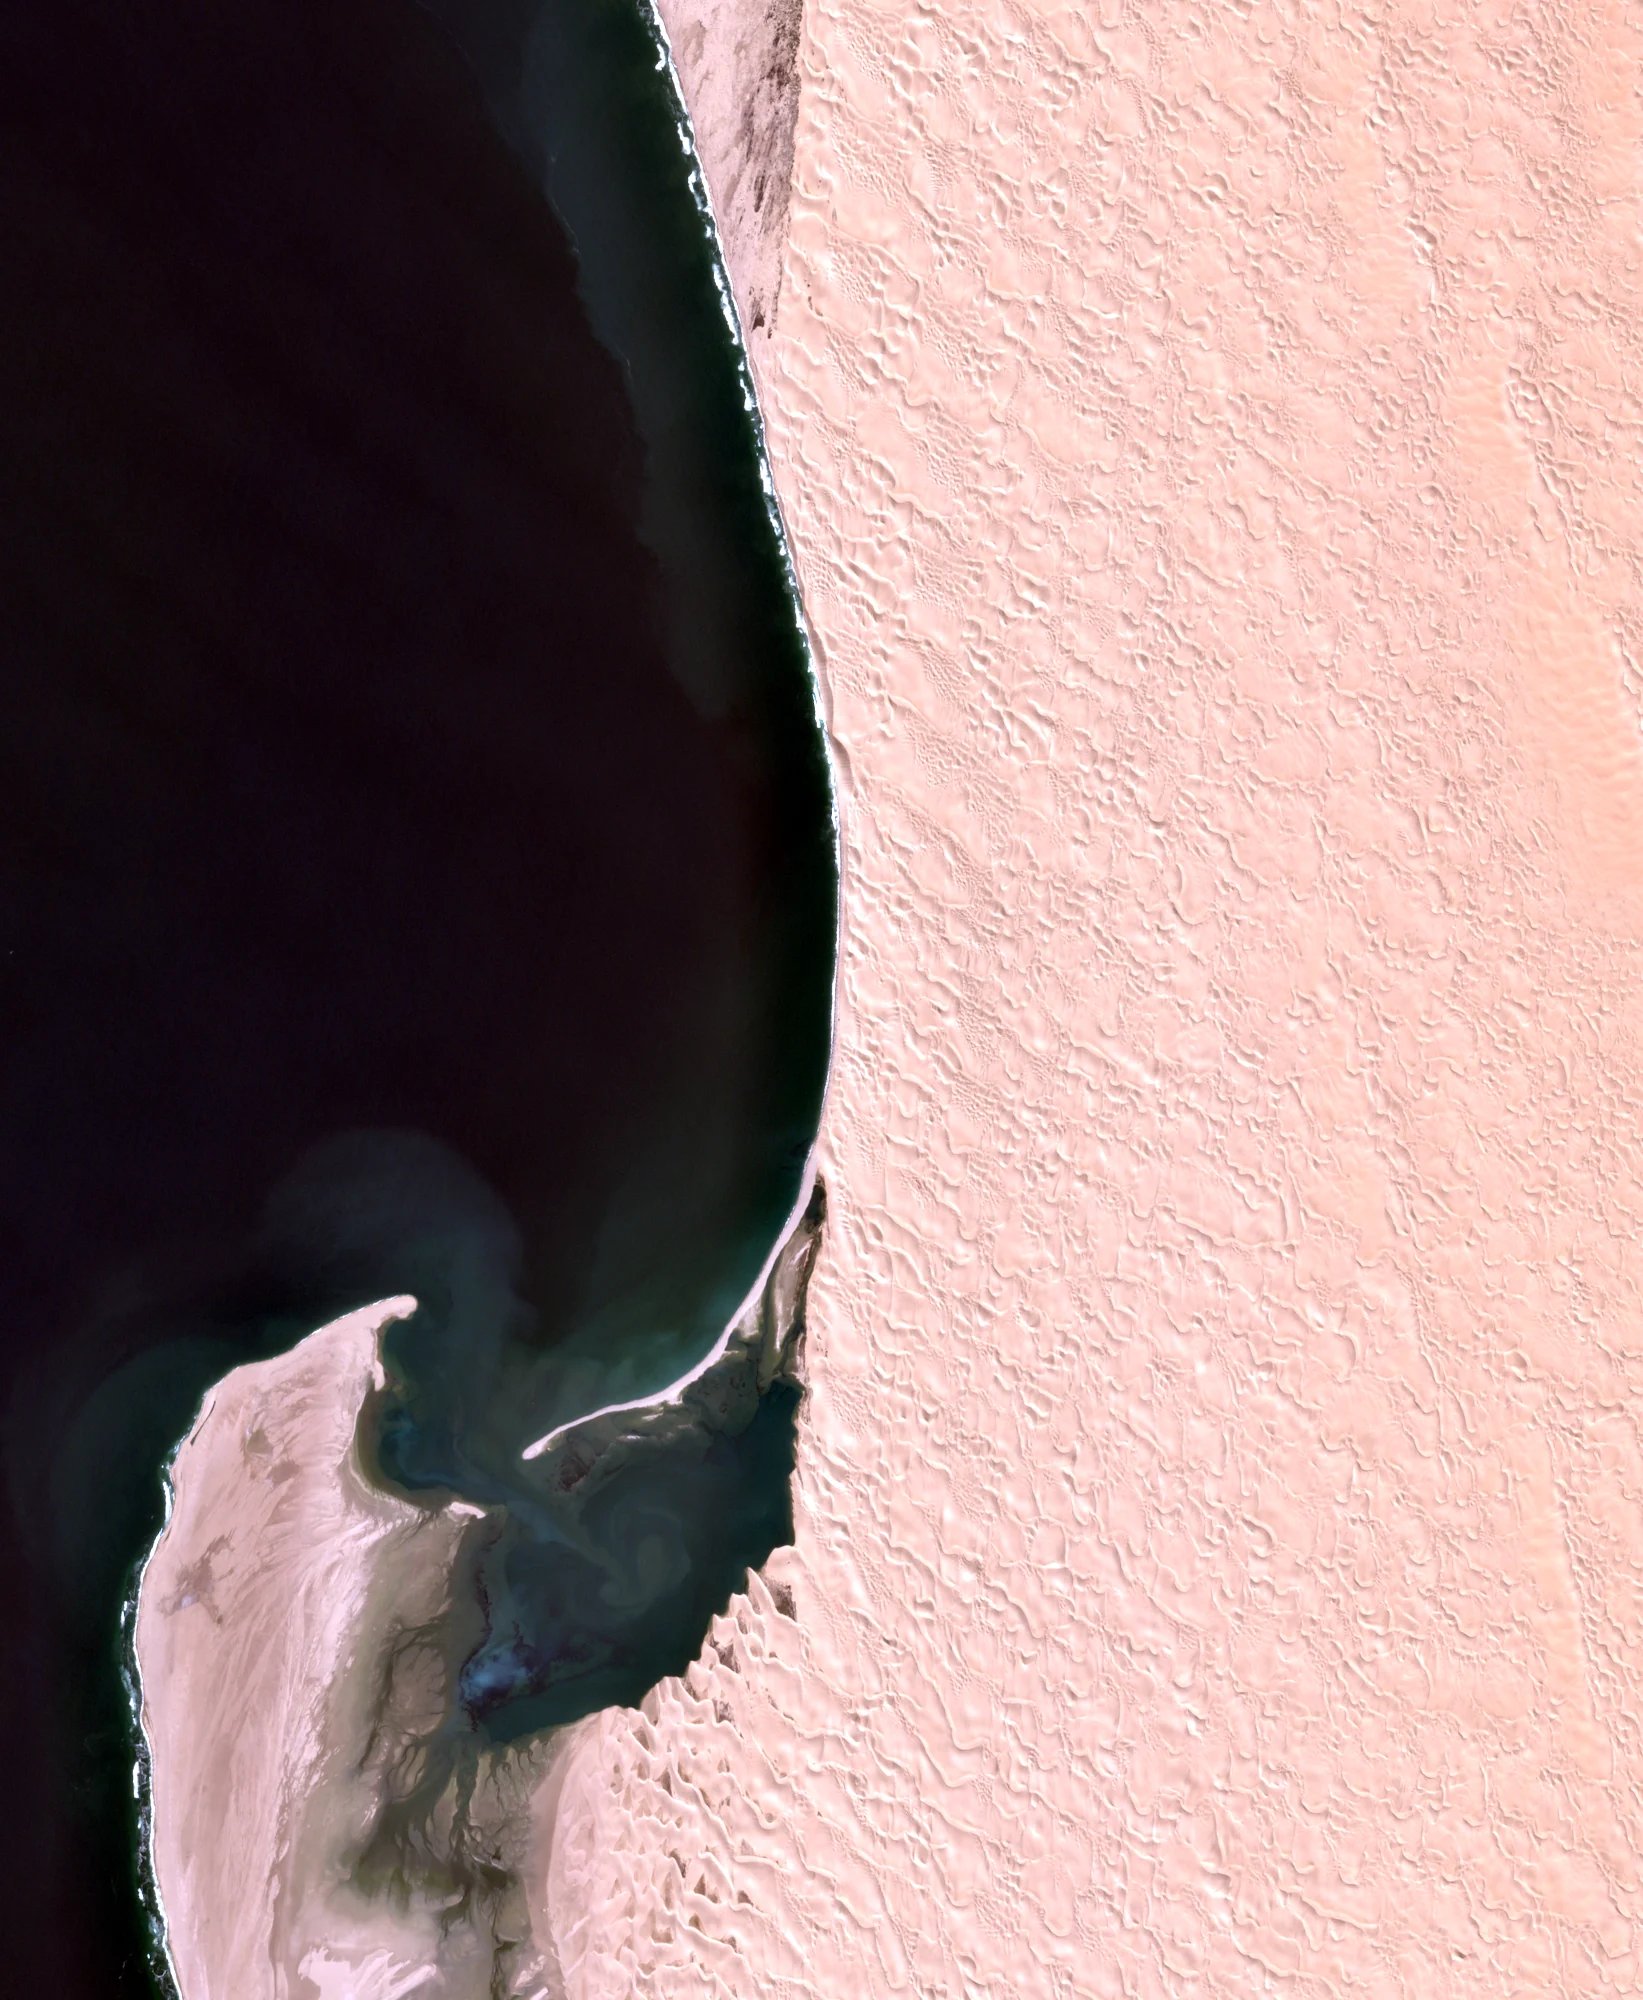
Tilebox indexes Sentinel-2 metadata and public asset locations in the `open_data.aws_earth.sentinel2` dataset. In this guide, you query a cloud-free scene over Sandwich Harbour in Namibia, read a small window from its red, green, and blue Cloud Optimized GeoTIFFs (COGs), and combine the bands into an RGB image.
Asset collections and the storage client are currently available in the Python SDK.
## Prerequisites
* You have a [Tilebox API key](/authentication).
* You have Python 3.11 or newer.
```bash theme={"system"}
uv add tilebox shapely numpy pillow
```
## Select a cloud-free scene
Define a small area around Sandwich Harbour and query Sentinel-2 Level-2A scenes from June 17, 2024. Select the result with the least cloud cover.
```python Python theme={"system"}
from shapely import box
from tilebox.datasets import Client, field
# west, south, east, north
area = box(14.42, -23.43, 14.58, -23.25) # Sandwich Harbour, Namibia
collection = Client().dataset("open_data.aws_earth.sentinel2").collection("L2A")
scenes = collection.query(
temporal_extent=("2024-06-17", "2024-06-18"),
spatial_extent=area,
filter=field("cloud_cover") < 1,
)
datapoint = scenes.sortby("cloud_cover").isel(time=0)
print(datapoint.stac_id.item(), datapoint.cloud_cover.item())
```
See [Query open data metadata](/guides/datasets/query-satellite-data) for broader temporal, spatial, and field-filtering patterns.
## Resolve the RGB assets
Convert the datapoint into an asset collection:
```python Python theme={"system"}
from tilebox.datasets.assets import AssetCollection
assets = AssetCollection.from_datapoint(datapoint)
```
## Read and combine the bands
Open the three COGs and read only the window that covers the area of interest. The bands share the same pixel grid, so you can fetch them concurrently and stack them directly.
```python Python theme={"system"}
import asyncio
import numpy as np
from tilebox.storage.aio import Client as StorageClient
from tilebox.storage.geotiff import window_from_bounds
async def read_rgb():
storage = StorageClient()
async def read_band(key):
asset = assets[key]
geotiff = await storage.open_geotiff(asset)
window = window_from_bounds(geotiff, area.bounds, crs="EPSG:4326")
raster = await geotiff.read(window=window)
pixels = raster.data[0].astype(np.float32)
return pixels * asset.raster.scale + asset.raster.offset
red, green, blue = await asyncio.gather(
read_band("red"),
read_band("green"),
read_band("blue"),
)
return np.stack((red, green, blue), axis=-1)
rgb = asyncio.run(read_rgb())
```
The asset metadata supplies the scale and offset that convert stored pixel values to surface reflectance.
## Render the RGB image
Apply a display stretch, gamma correction, and a small contrast clip, then save the array as a PNG:
```python Python theme={"system"}
from PIL import Image, ImageOps
display_rgb = np.power(np.clip(rgb / 0.3, 0, 1), 1 / 2.2)
image = Image.fromarray((display_rgb * 255).astype(np.uint8))
image = ImageOps.autocontrast(image, cutoff=0.5)
image.save("sentinel2-sandwich-harbour.png")
```
`ImageOps.autocontrast` is only intended for visualization. Keep the original reflectance values when calculating indices or running quantitative analysis.
 ## Next steps
Render an all-weather SAR observation over Venice.
Learn about streaming, downloads, GeoTIFF access, and location selection.
## Next steps
Render an all-weather SAR observation over Venice.
Learn about streaming, downloads, GeoTIFF access, and location selection.